⚡ Quick Answer
Press [STAT] → Edit, enter your data in L1, then press [STAT] → CALC → 1 (1-Var Stats) → [ENTER]. The screen shows Sx (sample standard deviation) and σx (population standard deviation). Use Sx for most school problems. Keep reading for a full worked example with real numbers.
What Is Standard Deviation? (Simple Explanation)
Standard deviation sounds scary. But it is really just one idea: how spread out are the numbers in your data set?
Let me give you two examples. Imagine you have two groups of students and their test scores:
- Group A scores: 70, 71, 72, 73, 74 — Every student scored very close to the average. Scores are tight together.
- Group B scores: 40, 60, 72, 85, 103 — Students scored all over the place. Scores are spread far apart.
Both groups have the same average (72). But standard deviation tells you what plain averages cannot — that Group B's scores are all over the place. Group A has a low standard deviation (scores are close together). Group B has a high standard deviation (scores are far apart).
The TI-84 calculates this automatically. You do not need to know the formula at all. You just enter the data and read the answer.
Standard deviation is used in AP Statistics, college statistics courses, psychology research, business, and science. Knowing how to find it quickly on a TI-84 saves you enormous amounts of time — especially during exams.
Sample Standard Deviation (Sx) vs Population Standard Deviation (σx)
When you run 1-Var Stats on your TI-84, you get two standard deviation values. Students always ask: which one do I use? Here is the simple rule:
| Symbol | Name | When to Use | Example |
|---|---|---|---|
| Sx | Sample Standard Deviation | When your data is a sample from a larger group | You survey 30 students out of 1,000 in your school |
| σx | Population Standard Deviation | When your data includes everyone in the group | You record the scores of ALL 5 students in a class |
Simple rule for school problems: If the question says "sample" or gives you data from a subset of a larger group, use Sx. If the data represents the entire group you are studying, use σx. When in doubt, your teacher will specify — or use Sx, as it is correct for most statistics homework.
4 Steps to Find Standard Deviation on TI-84
We will use this example data set throughout this guide. Imagine these are the quiz scores of 6 students: 65, 70, 72, 75, 80, 88
-
1
Press [STAT] → Edit to Open the List Editor
Press the STAT button. A menu appears with two tabs: EDIT and CALC. Press 1 (or just press Enter) to select Edit. The List Editor opens, showing columns labeled L1, L2, L3. Your cursor should be in the L1 column ready for input.
-
2
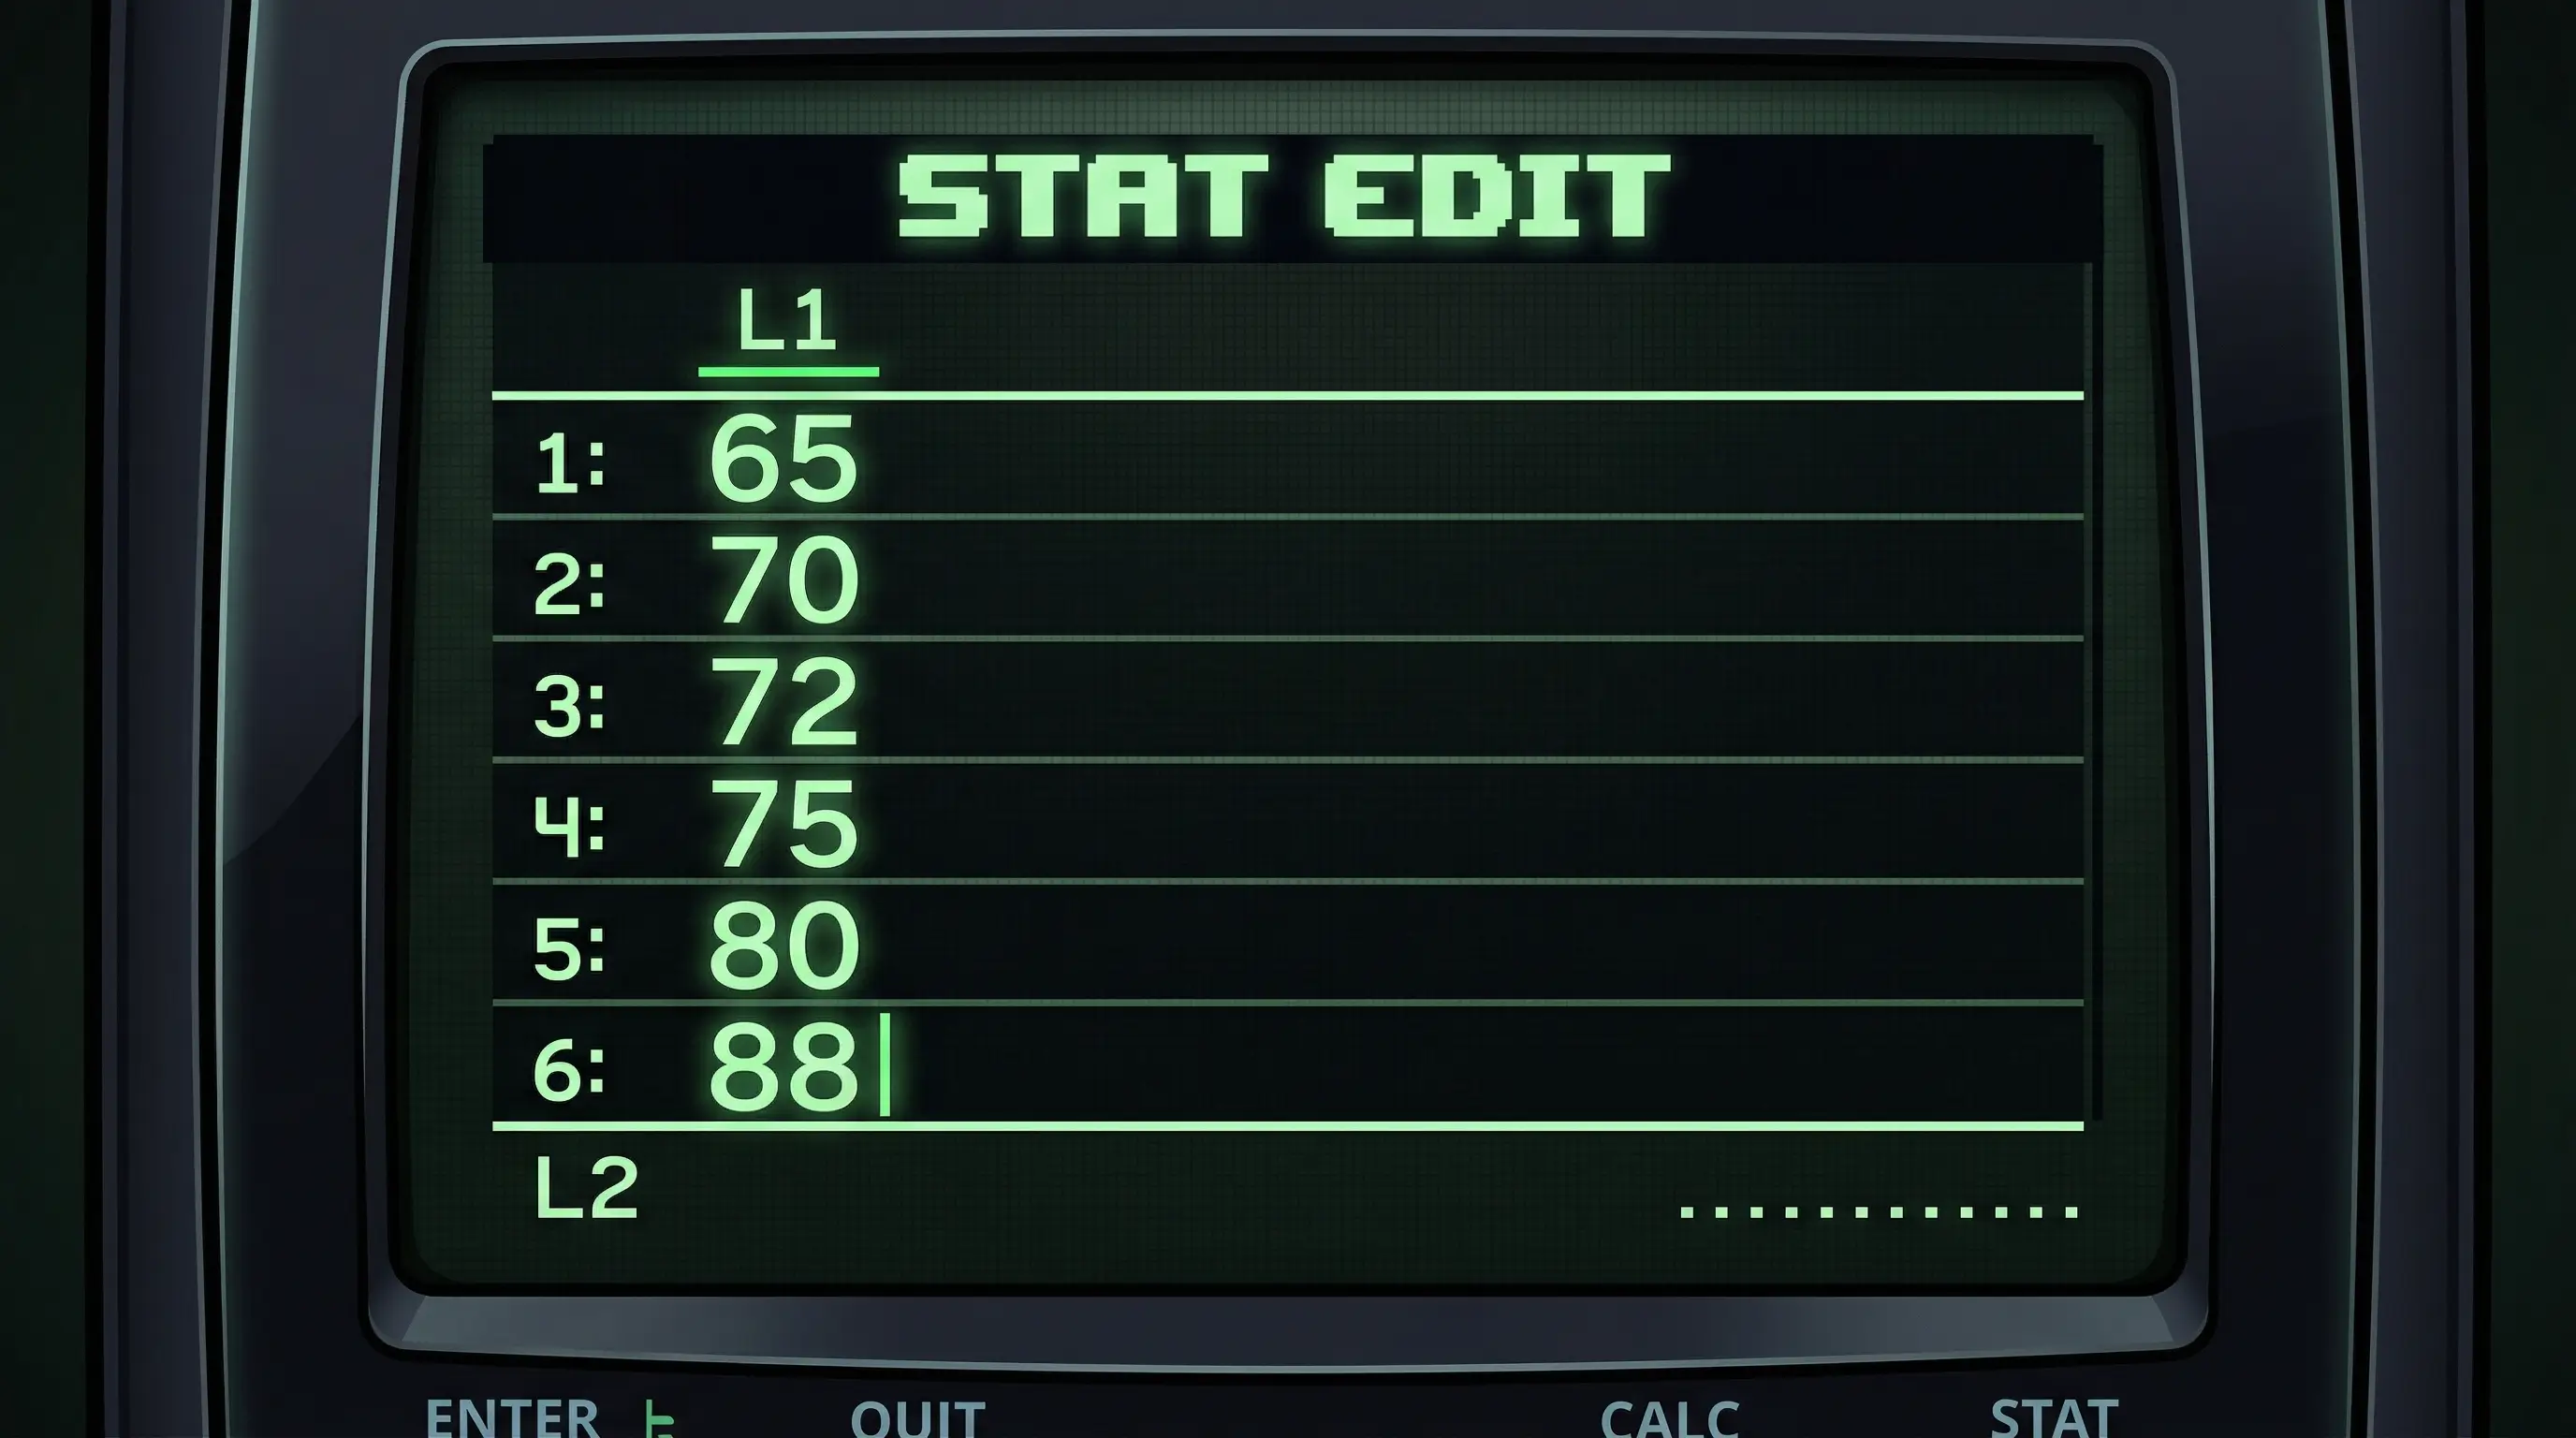
Enter Your Data in L1
Type each number and press ENTER after each one. For our example: type 65 → ENTER, then 70 → ENTER, then 72 → ENTER, then 75 → ENTER, then 80 → ENTER, then 88 → ENTER. You should see all 6 numbers listed in the L1 column.
Old data in L1? Before entering new data, clear the old data first. In the List Editor, move the cursor all the way up to the L1 header (the actual column title, not the first data cell). Press CLEAR then ENTER. The entire column clears instantly.
-
3
Press [STAT] → CALC → 1 (1-Var Stats) → [ENTER]
Press STAT again. This time, press the right arrow key ► to move to the CALC tab. Press 1 to select 1-Var Stats. On newer TI-84 Plus CE models, a dialog box appears asking which list to use. Make sure it says List: L1 and FreqList: (blank). Press ENTER or highlight Calculate and press Enter.
-
4
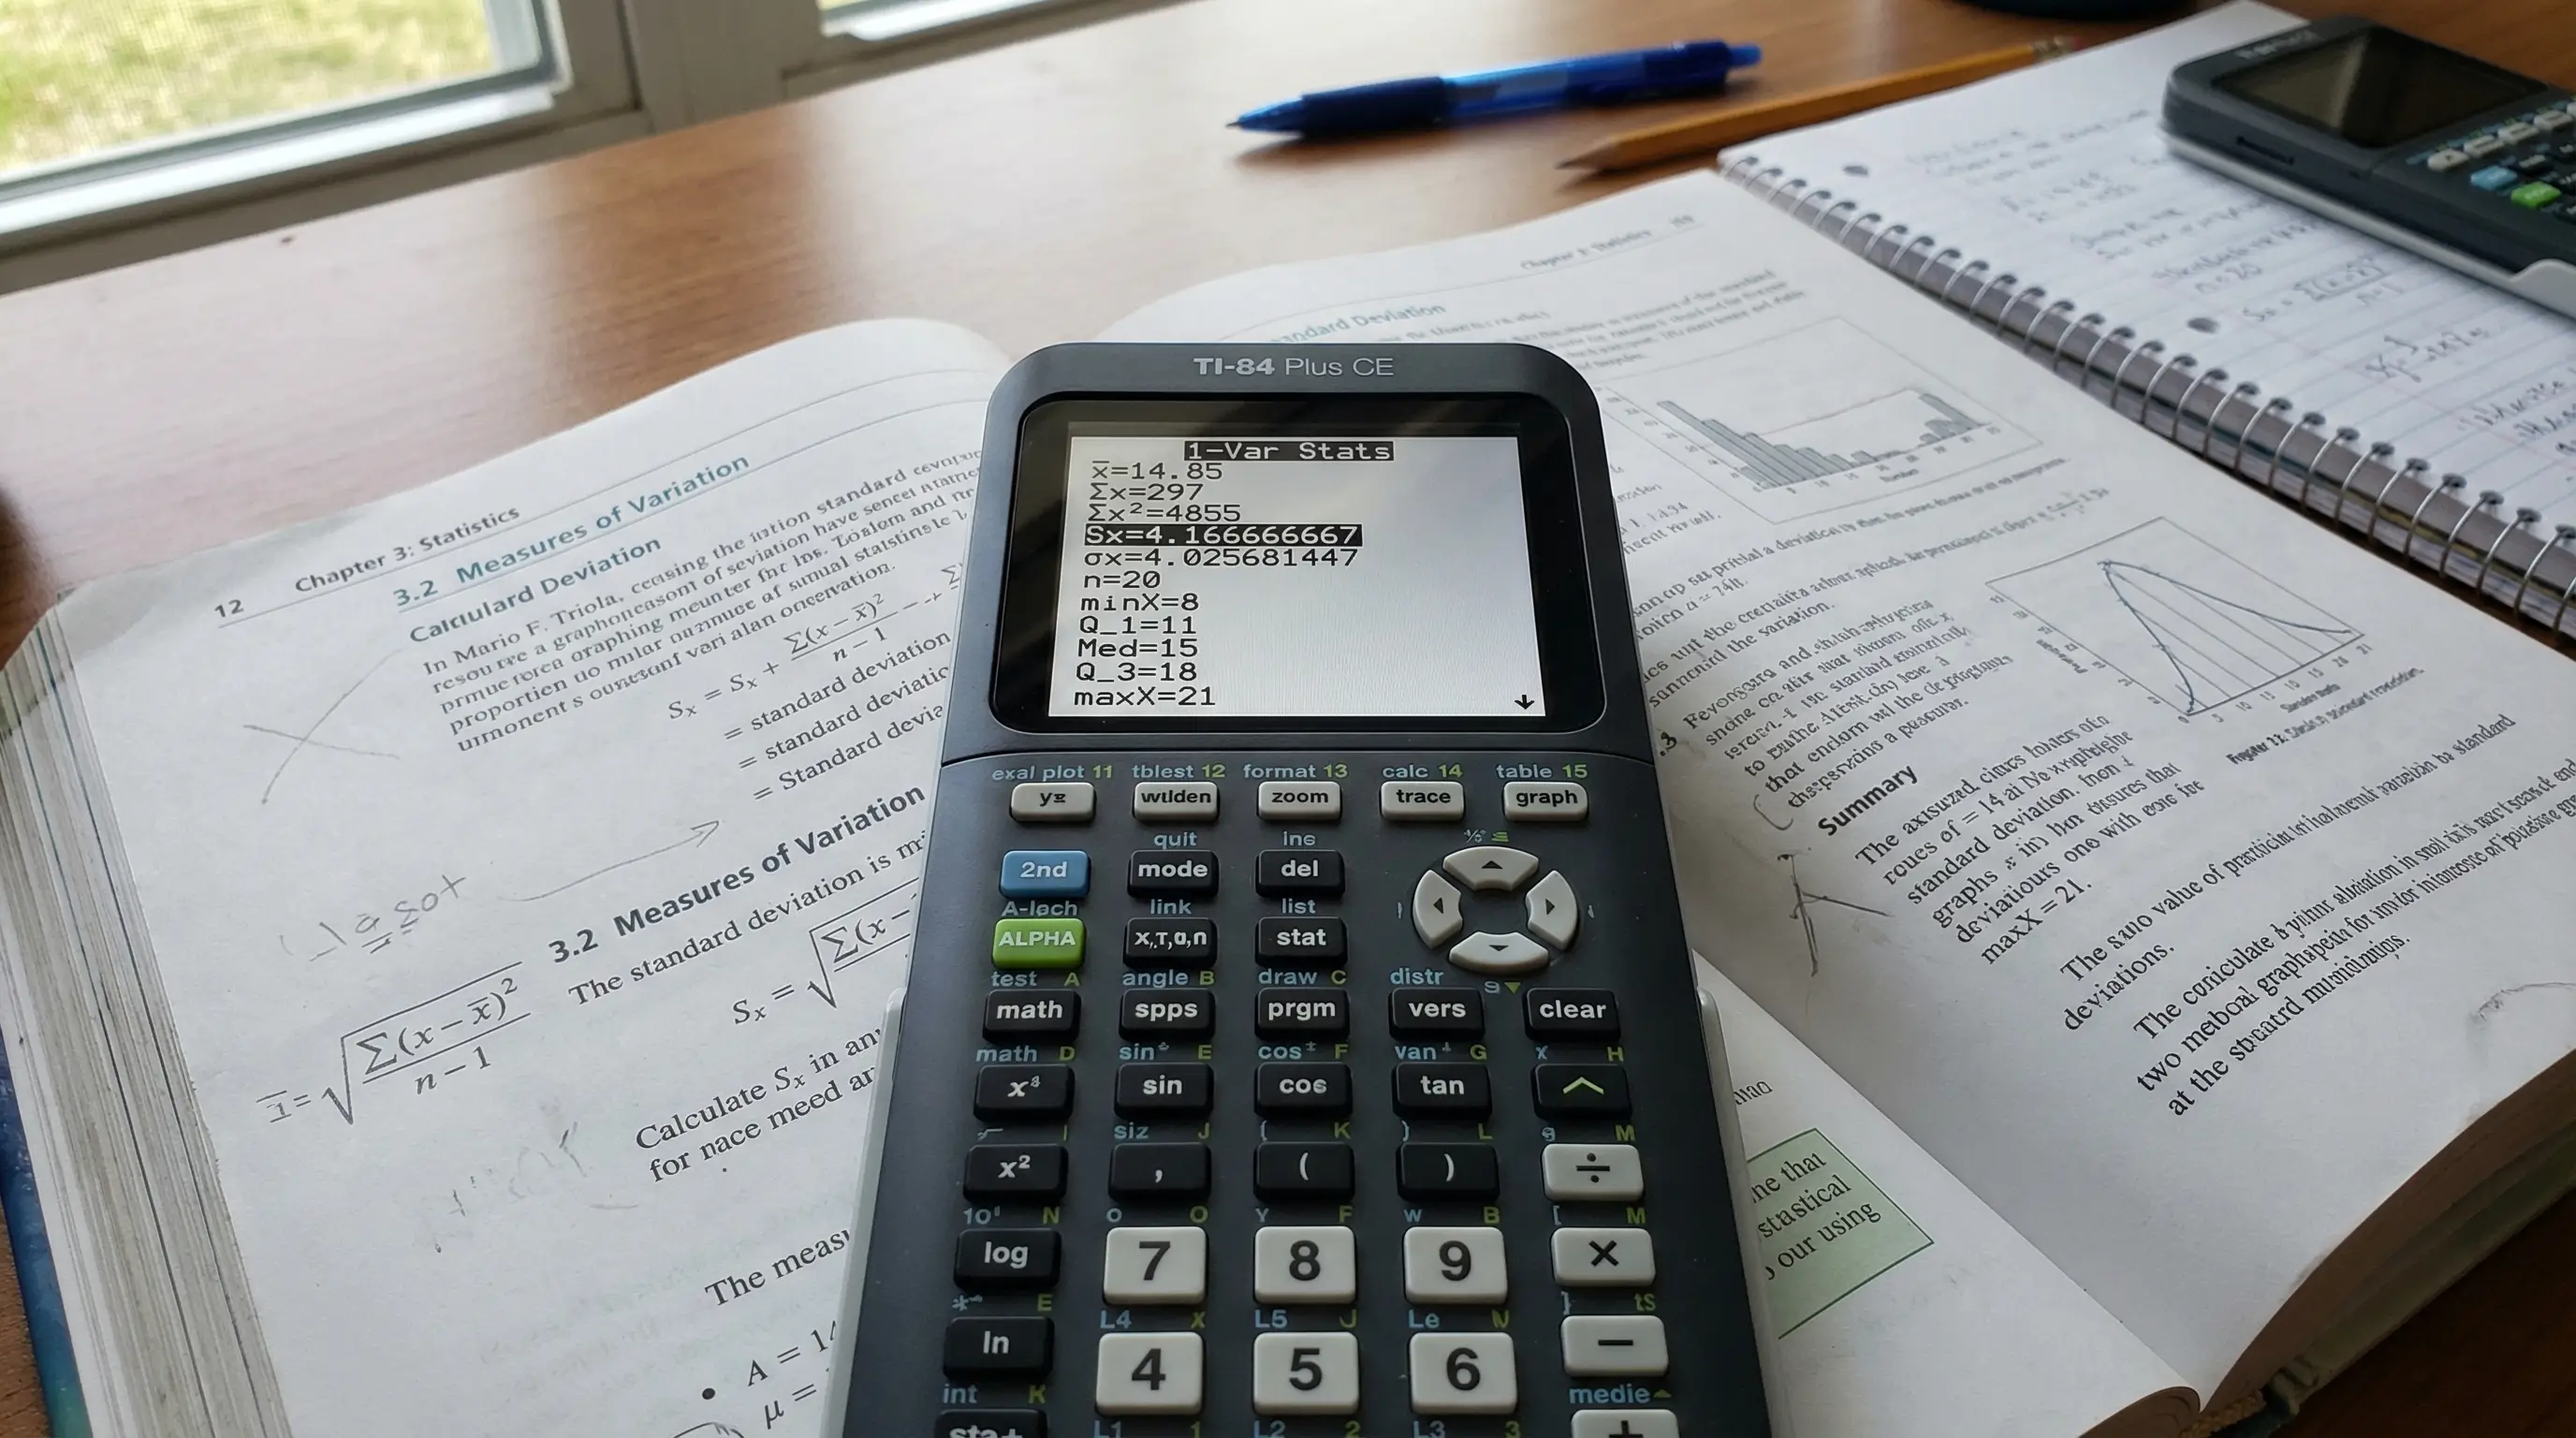
Read the Results — Look for Sx and σx
The results screen appears with many values. Scroll down using the ▼ arrow key to see everything. The values you need for standard deviation are: Sx (sample standard deviation) and σx (population standard deviation). Write them down or screenshot them — the exercise is done!
Reading the 1-Var Stats Results Screen
When you run 1-Var Stats, the TI-84 gives you a full statistical summary of your data. Here is what every value means:
| Symbol | What It Means | Used For |
|---|---|---|
| x̄ | Mean (average) of the data | Finding the center of data |
| Σx | Sum of all values | Total of all data points |
| Σx² | Sum of squares of all values | Used internally in std dev formula |
| Sx | Sample standard deviation | Spread of a sample from a larger group |
| σx | Population standard deviation | Spread of an entire population's data |
| n | Number of data points | Count of values in your list |
| minX | Smallest value in the data | Range calculations |
| Q1 | First quartile (25th percentile) | Box plots, IQR |
| Med | Median (middle value) | Center of data, resistant to outliers |
| Q3 | Third quartile (75th percentile) | Box plots, IQR |
| maxX | Largest value in the data | Range calculations |
Full Worked Example (With Real Numbers)
Let's go all the way through our example data: 65, 70, 72, 75, 80, 88
After following the 4 steps above, your TI-84 screen should look something like this:
x̄ = 75 ← Mean (average)
Σx = 450
Σx² = 34218
Sx = 8.337... ← Sample Std Dev ✅
σx = 7.616... ← Population Std Dev
n = 6 ← 6 data points ✅

How to Interpret This Result
Our sample standard deviation is Sx ≈ 8.34. What does this actually mean?
It means that on average, each student's quiz score is about 8.34 points away from the class average of 75. That is a moderate spread — not too tight, not too wild.
If Sx were 2, scores would be very close together (everyone got around 75). If Sx were 25, scores would be all over the place (big differences between students). The bigger the standard deviation, the more "spread out" the data is.
You just calculated standard deviation on a TI-84 — the same way statisticians, scientists, and data analysts do it every day. A calculation that would take 5 minutes by hand took you under 60 seconds with the calculator.
Standard Deviation for Two Data Sets at Once
Sometimes you need to compare the spread of two groups. For example, Class A and Class B both took the same test. You want to know which class had more consistent scores. Here is how you do it:
-
1
Enter Class A data in L1, Class B data in L2
Press STAT → Edit. Enter Class A scores in L1 (one value per row). Then press the right arrow to move to L2 and enter Class B scores there.
-
2
Run 1-Var Stats on L1 first
Press STAT → CALC → 1. In the dialog box, make sure List says L1. Press Enter to calculate. Note down the Sx value for Class A.
-
3
Repeat for L2
Press STAT → CALC → 1 again. This time change the List to L2 (press 2nd + 2 to type L2). Press Enter. Note down Sx for Class B. Now compare the two Sx values — the higher one had more spread.
On older TI-84 Plus models (non-CE), after selecting 1-Var Stats you type 2nd + 1 (for L1) or 2nd + 2 (for L2) directly on the command line, then press Enter.
Common Mistakes and How to Fix Them
These are the errors I see students make most often in statistics class. All of them are easy to fix once you know what caused the problem:
-
ERR: DIM MISMATCH
This means your L1 and L2 lists have different numbers of entries. Go to STAT → Edit and check both lists. Either add missing entries or clear the extra list. When running 1-Var Stats for one list, make sure FreqList is blank. -
Getting a different Sx than expected
Check that your old L1 data was cleared before entering new numbers. Old leftover values count in the calculation and will throw off your answer. Always clear L1 first. -
Sx and σx look similar but one is slightly smaller
This is normal. σx is always slightly smaller than Sx. This is because their formulas differ in one spot (dividing by n vs n−1). It is not a mistake — just choose the right one for your problem. -
1-Var Stats shows σx = 0
This means every number in your list is identical (e.g., all 5s). A standard deviation of zero means there is no spread at all — every value is the same. Check your data entry. -
n shows a wrong count
You may have accidentally left blank entries or duplicate entries. Press STAT → Edit and carefully count the values in L1. Make sure there are no extra empty rows below your last value.
When Do You Need Standard Deviation?
Standard deviation shows up in a lot more places than just statistics class. Here are real-world situations where you'd use it:
| Situation | What Standard Deviation Tells You |
|---|---|
| Class test scores | How consistent or inconsistent student performance was |
| Stock market prices | How volatile (risky) a stock is — higher std dev = more risk |
| Manufacturing quality control | Whether products are being made consistently to spec |
| Sports performance | Whether an athlete is consistent or unpredictable |
| Weather data | How much temperatures vary from the average in a region |
| Scientific experiments | How reliable and repeatable the results are |
On AP Statistics exams, the SAT, and ACT, standard deviation problems often give you a data set and ask for the correct interpretation. Knowing how to calculate it fast on your TI-84 — and knowing what the number means — puts you ahead of everyone who is still doing it by hand.
🖩 Practice Statistics on Our Free TI-84
Try entering the example data set right now using our free browser-based TI-84 Plus CE emulator. It works exactly like the real calculator — including the full STAT menu and 1-Var Stats. No downloads, no account needed.
Launch Free TI-84 Calculator →For quick statistical calculations without the heavy menus, you can also use our TI-30XS Scientific Calculator.
Frequently Asked Questions
Press [STAT] → Edit, enter your data in L1 (one value per row, press Enter after each). Then press [STAT] → CALC → 1 (1-Var Stats) → Enter. The results screen shows Sx (sample std dev) and σx (population std dev). Use Sx for most school problems.
Sx is sample standard deviation — use it when your data is a sample taken from a larger population. σx is population standard deviation — use it when your data includes every single member of the group you are studying. For most high school and AP Stats problems, the correct answer is Sx.
Press [STAT] → Edit to open the list editor. Scroll up so the cursor is on the "L1" header text at the very top of the column — not on a data cell, but on the header. Press [CLEAR] and then [ENTER]. All rows in L1 will be deleted at once.
Yes. Enter the first data set in L1 and the second in L2. Run 1-Var Stats selecting L1 to get stats for the first set. Then run 1-Var Stats again selecting L2 to get stats for the second set. Compare the Sx values between the two sets.
This error means two lists have a different number of entries. The most common cause is old data left in L2 from a previous problem. In the 1-Var Stats dialog, make sure the FreqList field is blank (not L2). Or clear L2 by going to STAT → Edit, selecting the L2 header, and pressing CLEAR + ENTER.
Yes. Standard deviation is heavily tested on the AP Statistics exam. The SAT also tests statistical interpretation questions where knowing the standard deviation helps you choose the right answer. Always use your TI-84 to calculate it rather than doing it by hand — it is faster and less likely to produce arithmetic errors. Check our guide on using TI-84 on the SAT for more details.