⚡ Quick Answer
To graph on a TI-84, press [Y=], type your equation, then press [GRAPH]. That's the short version. If your screen looks blank, press [ZOOM] → 6 (ZStandard) to reset the view. The full step-by-step guide below walks you through every button — even if you have never touched a graphing calculator before.
Before You Start Graphing
I have worked with hundreds of students who were nervous about the TI-84 graphing functions. Most of them were scared because they did not know which buttons to press. Once they saw it in action for the first time, it clicked instantly.
Before you start graphing, there are three things you need to know about how the TI-84 works:
- The TI-84 graphs functions, not equations. It needs the equation in the form y = something. For example, y = 2x + 3 or y = x². If your equation is not in this form, you need to rearrange it first.
- You use the [X,T,θ,n] key for X. Do not type the letter X from the alphabet keys. Look for the green X,T,θ,n key on the left side of your calculator. That is the X variable.
- The graph appears in a window. The window is like a camera pointed at the coordinate plane. If your graph is outside the window's view, you will see a blank screen. We fix this with the ZOOM button.
Don't have a physical TI-84? No problem. Use our free TI-84 Plus CE online emulator — it works exactly the same way as the real thing, right in your browser. Follow along with every step below using the online version.
5 Steps to Graph Any Equation on TI-84
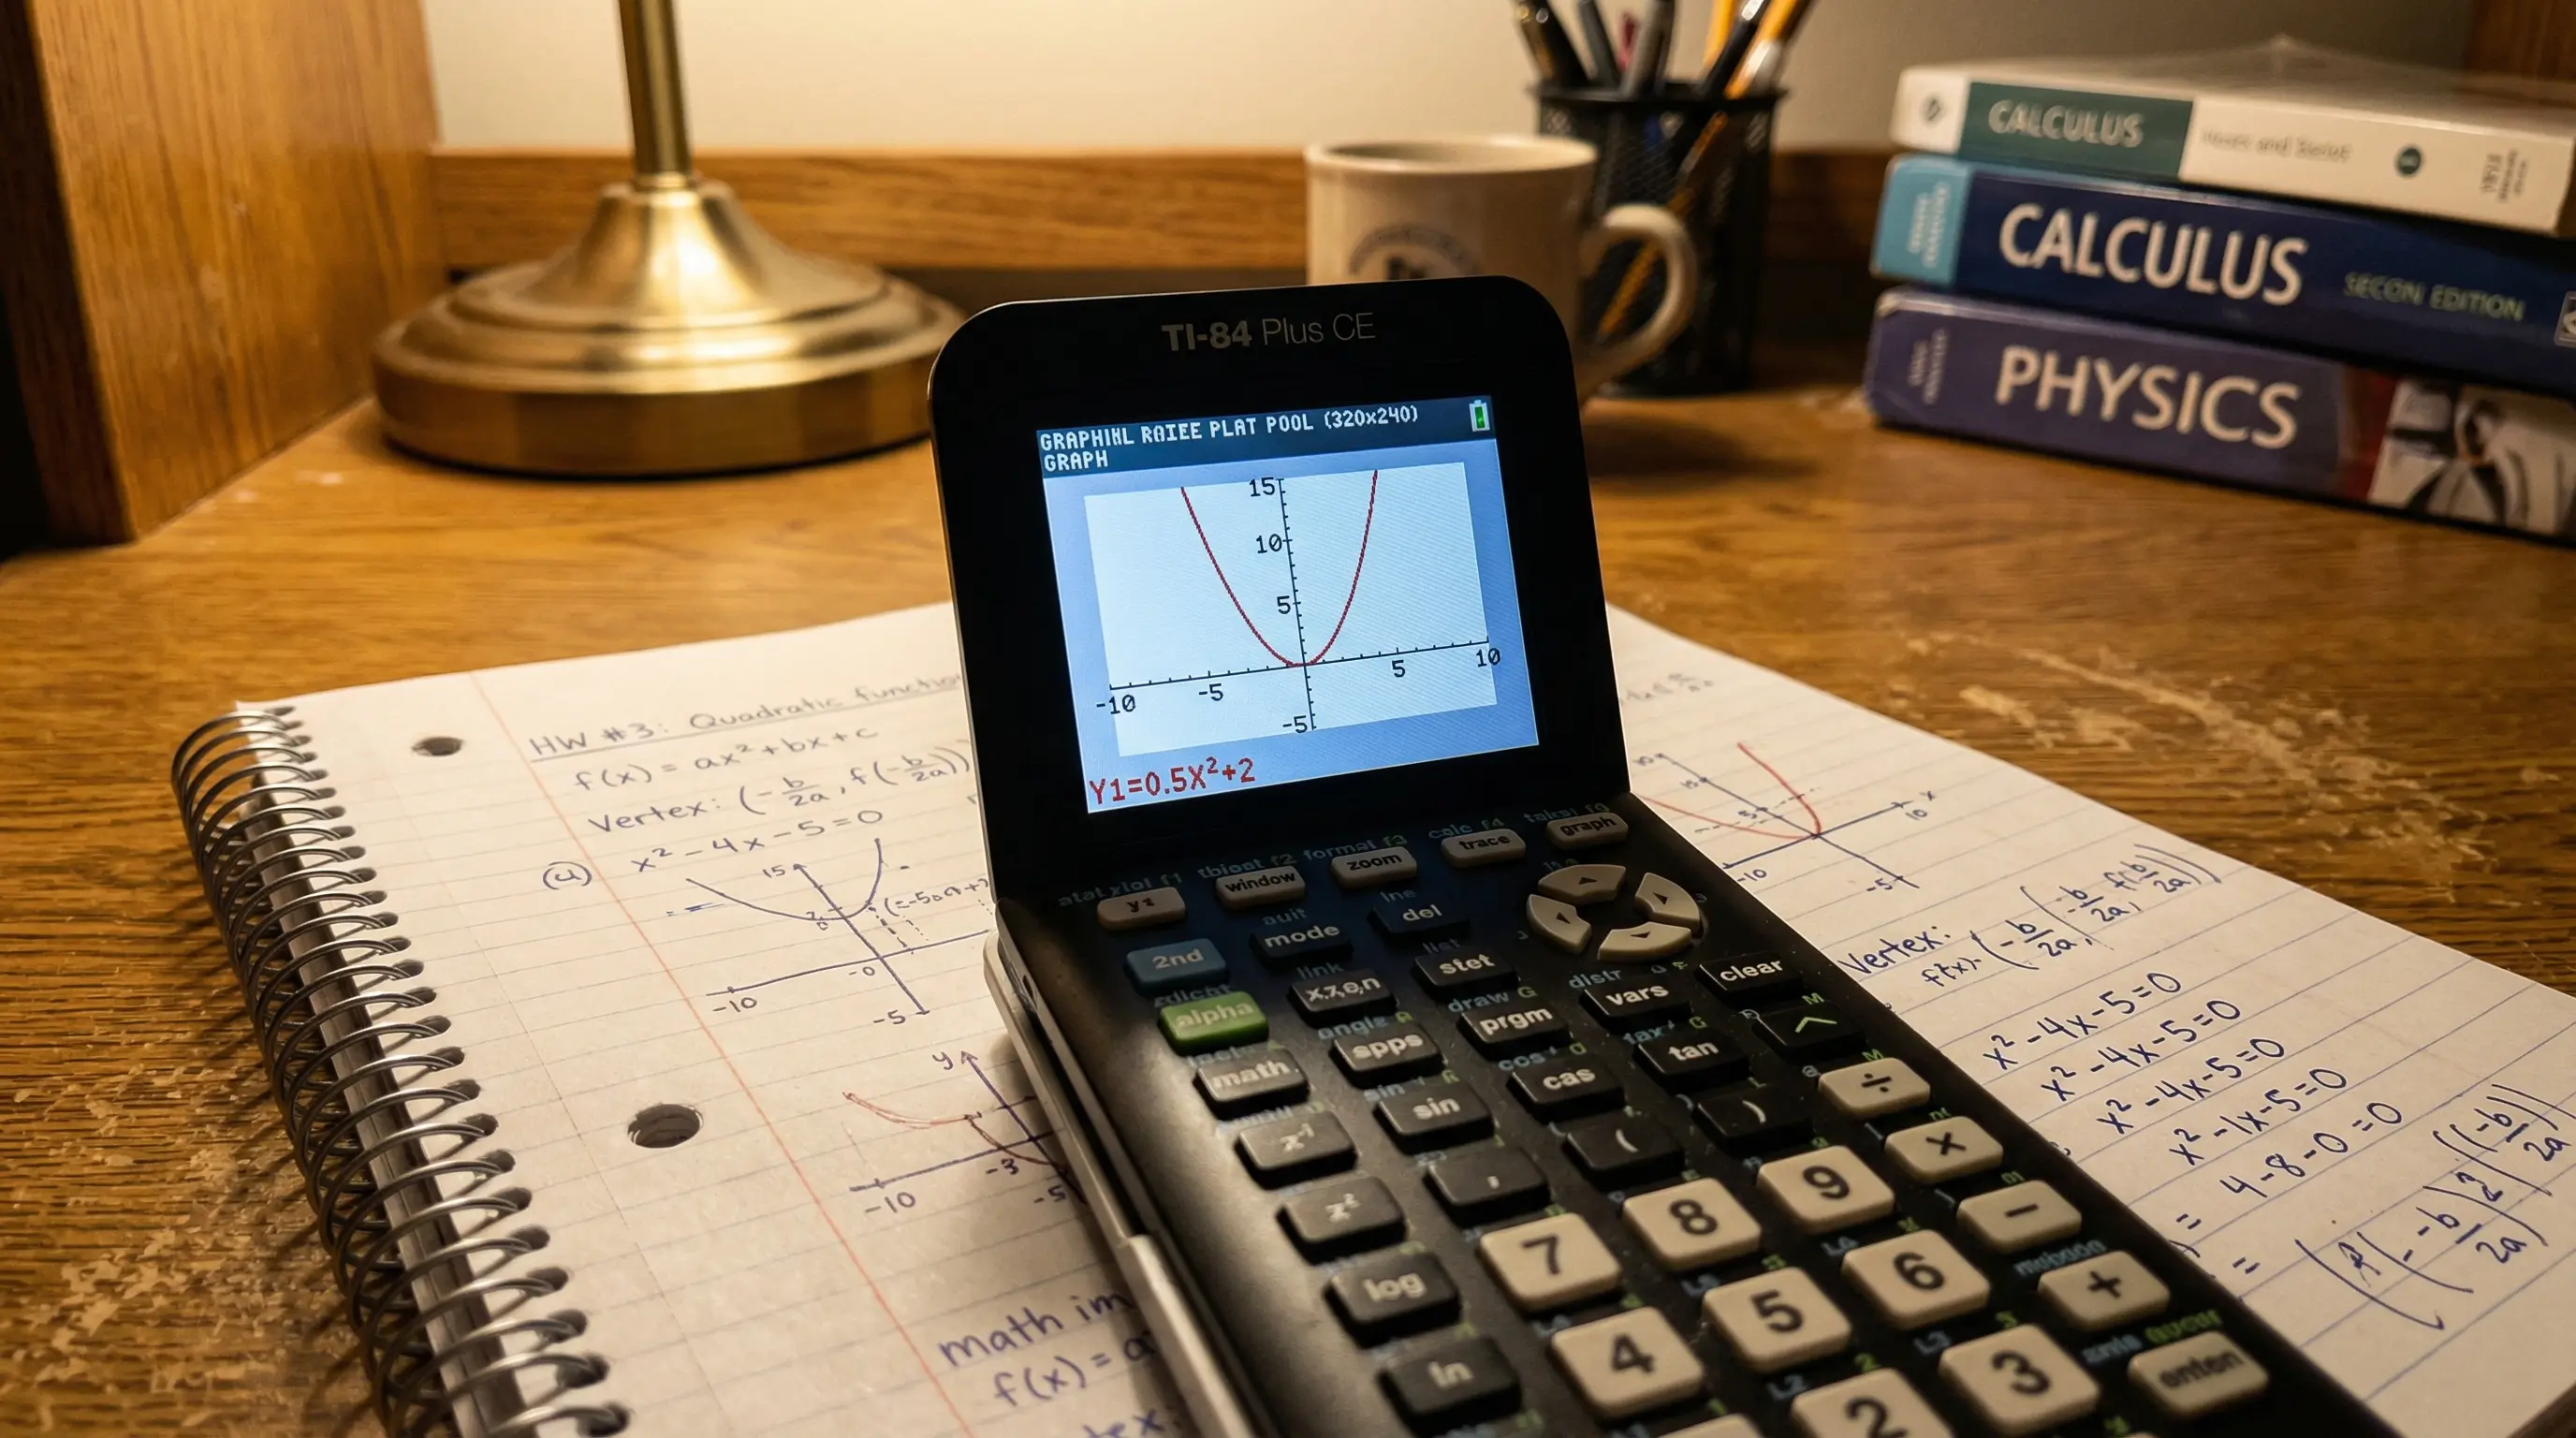
No matter what equation you want to graph — a straight line, a curve, a wave, or a parabola — these 5 steps always work. Let's use a simple example: y = 2x + 1 (a straight line).
-
1
Press the [Y=] Button
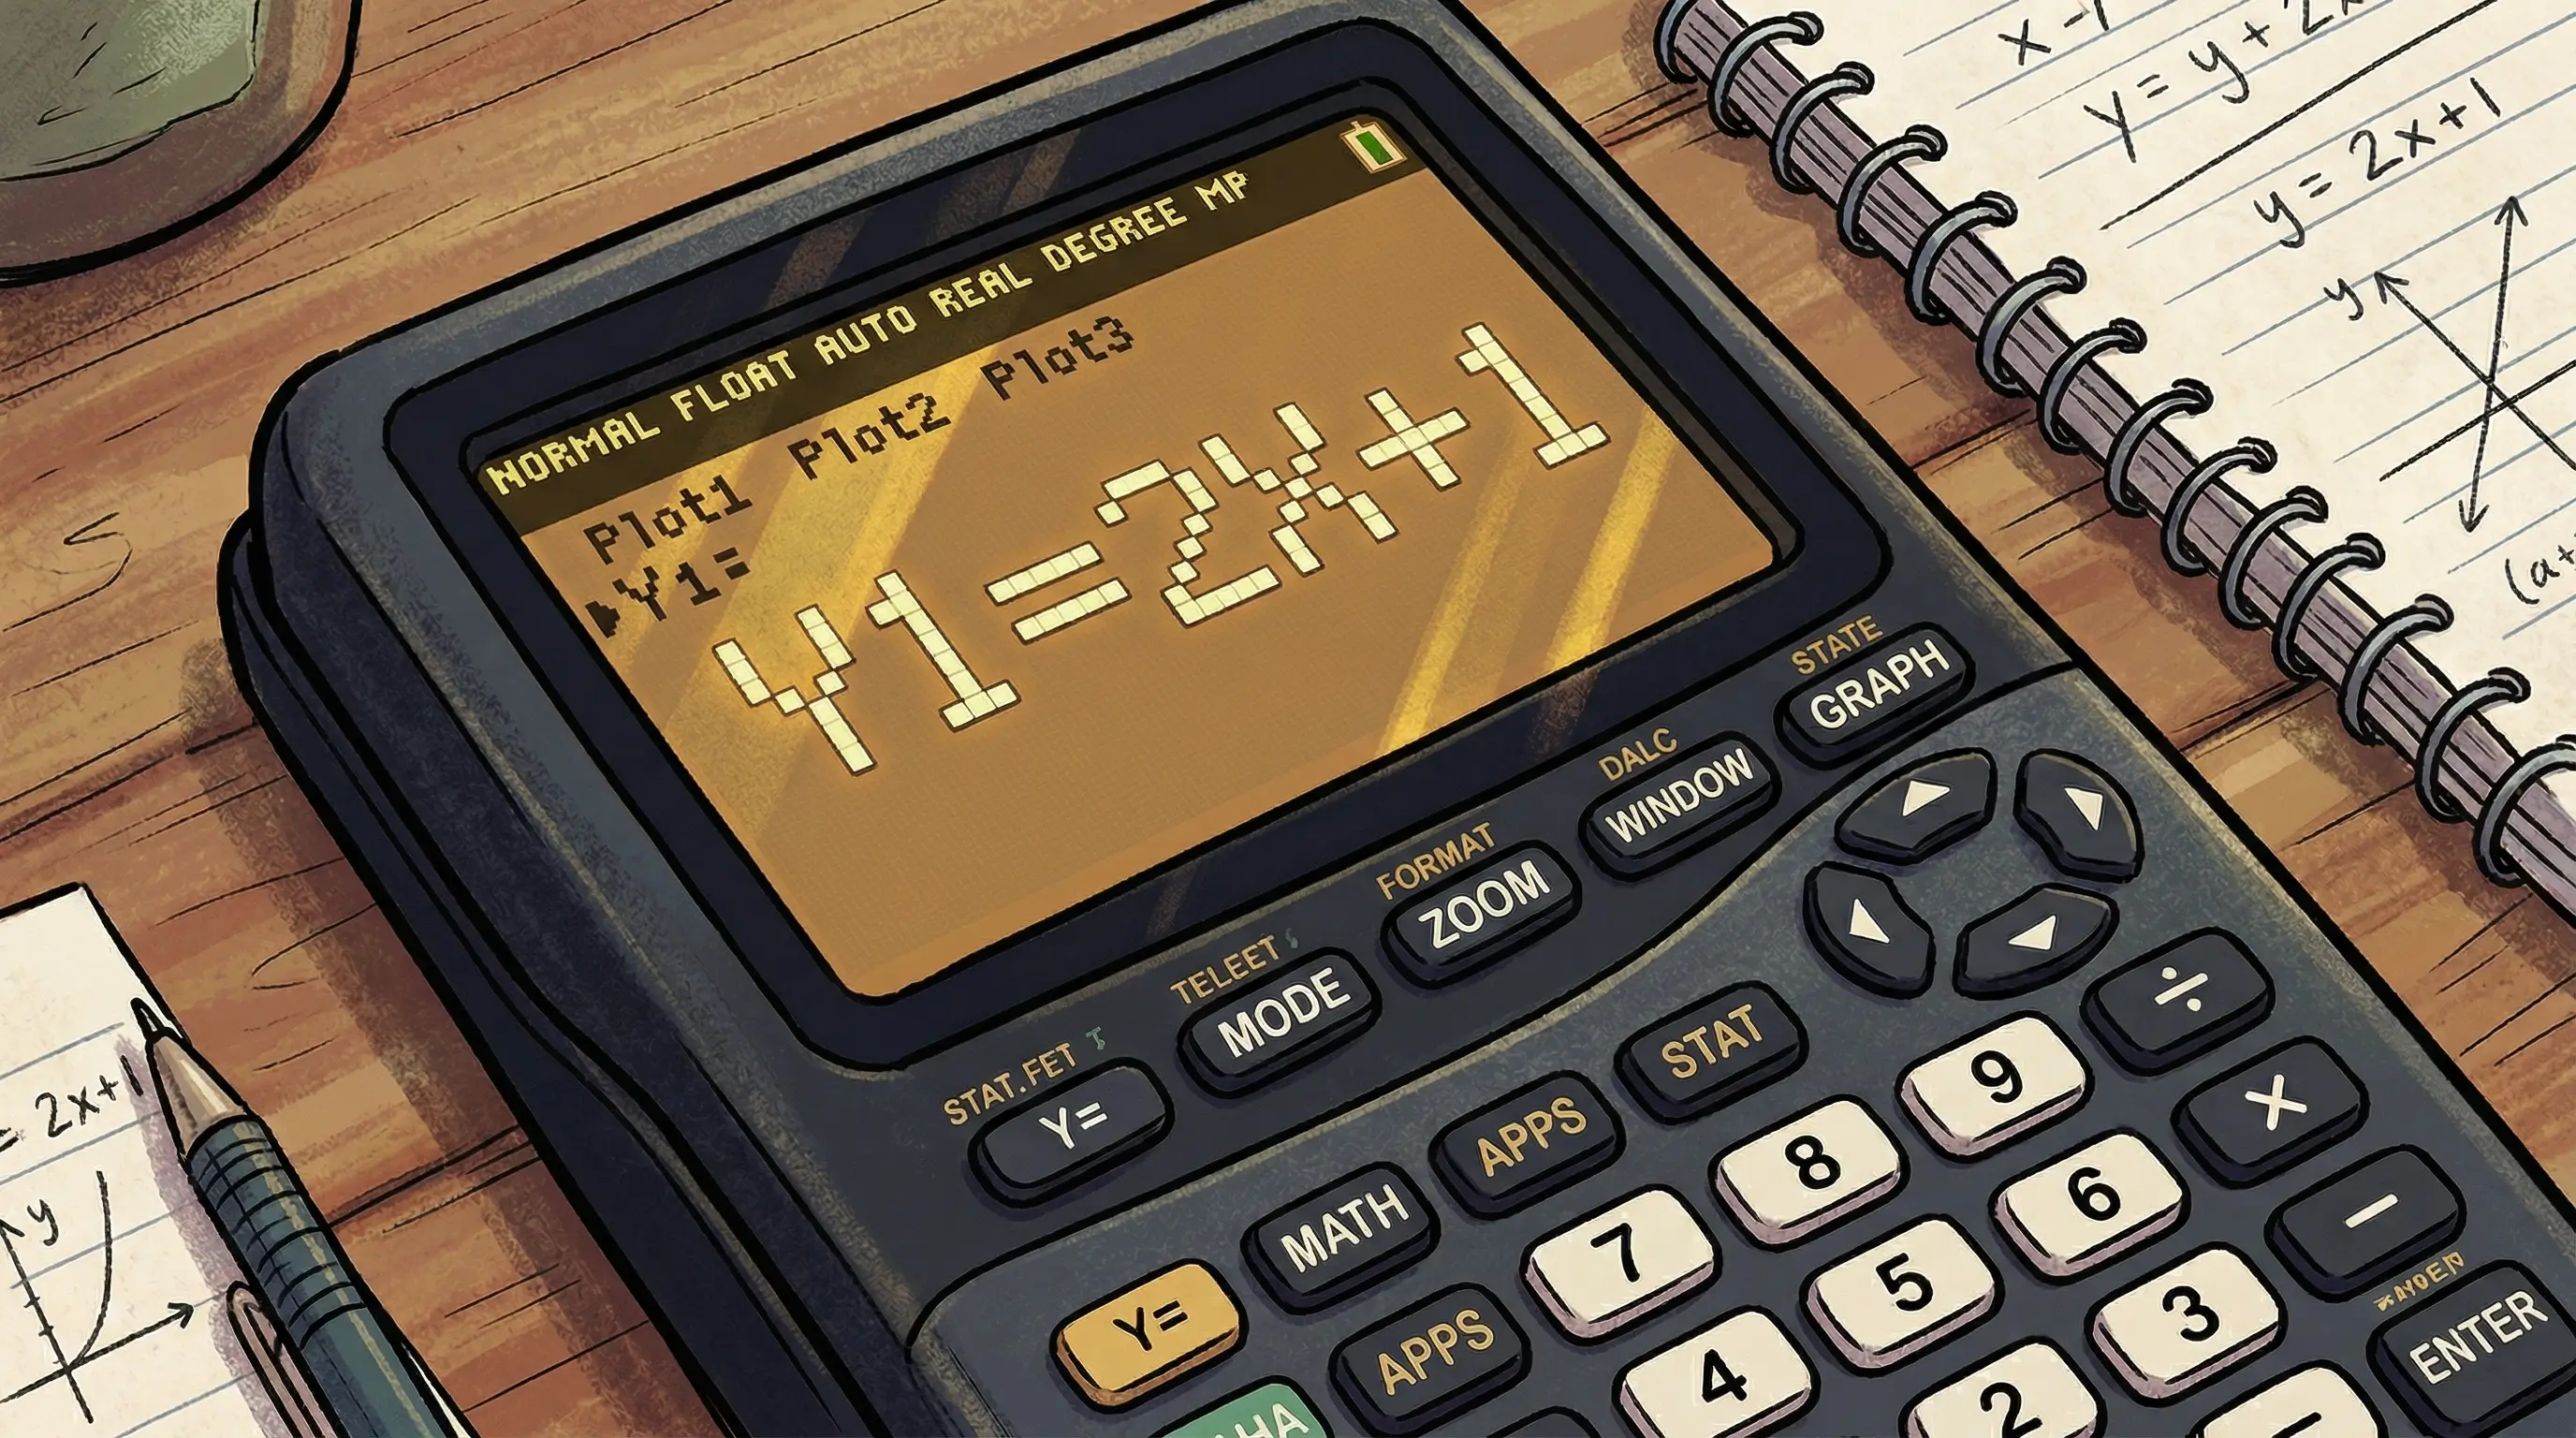
Look at the very top row of buttons on your TI-84. The first button on the left says Y=. Press it. A screen will appear with a list: Y1=, Y2=, Y3=, and so on. This is where you type your equation. Your cursor should be blinking right after Y1=.
-
2
Type Your Equation (for X, use [X,T,θ,n])
For our example, type 2X+1. Remember: press 2, then X,T,θ,n (the X key), then +, then 1. Do not press ENTER yet. Your screen should show Y1 = 2X+1.
Common mistake: Many students try to type X using the ALPHA + letter keys. That gives you a stored letter variable, not the graphing variable. Always use the dedicated X,T,θ,n key for X when graphing.
-
3
Check the WINDOW Settings
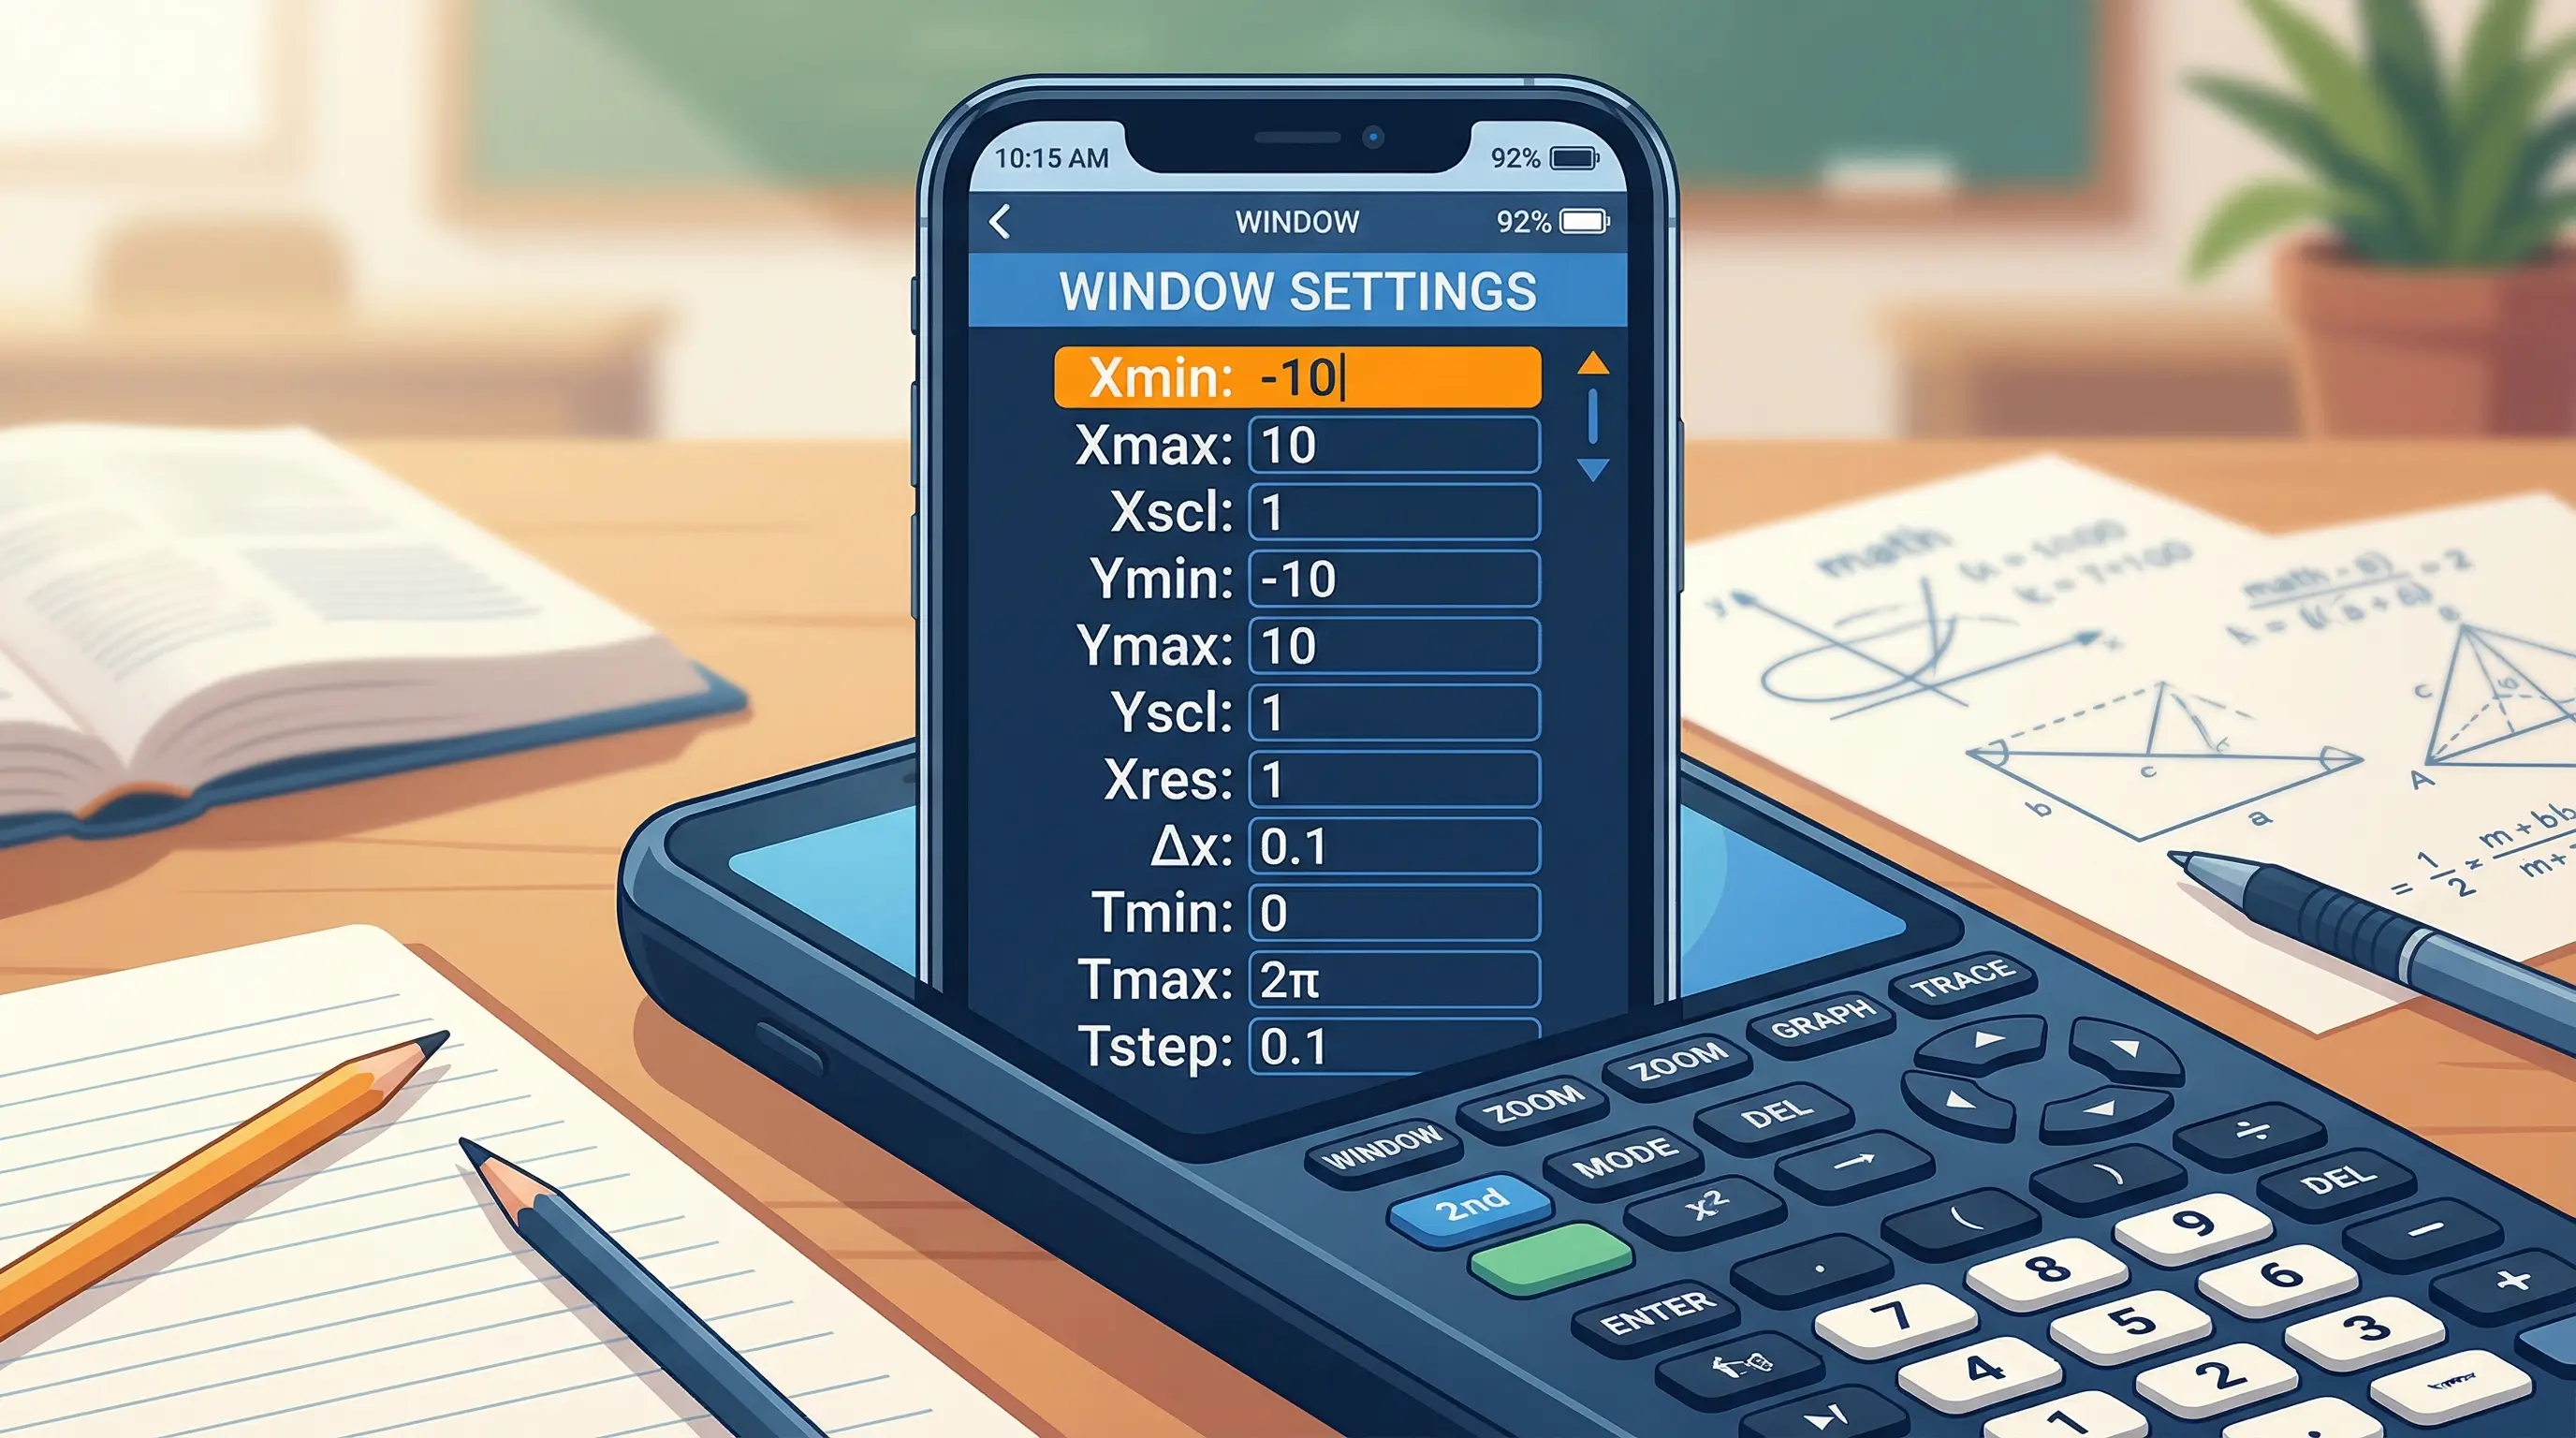
Press WINDOW (the second button in the top row). This shows you the "camera" settings for your graph. The key values are Xmin, Xmax, Ymin, and Ymax. By default, they are usually set to -10 and 10 for both axes — which is a great starting point. If you changed them before, reset by pressing ZOOM → 6 (ZStandard).
-
4
Press [GRAPH] — and Use ZOOM if the Screen Looks Wrong
Press GRAPH (the last button in the top row). Your line should appear on screen. If the screen is blank or you can't see the full line, press ZOOM → 6 to reset, or ZOOM → 0 (ZoomFit) to auto-fit the graph into view. You should now see a diagonal line going through the screen.
-
5
Press [TRACE] to Explore the Graph
Press TRACE (top row, second from right). A blinking cursor appears right on your line. Use the ◄ and ► arrow keys to move it along the graph. Watch the X and Y values update at the bottom of the screen. This is how you read exact coordinates off any point on the line.
Congratulations! You just graphed your first equation on a TI-84. Those 5 steps — Y= → Type → WINDOW → GRAPH → TRACE — work for every single equation you will ever graph on this calculator.
Understanding the WINDOW Settings
The WINDOW screen is like telling the calculator what part of the coordinate plane to show you. Think of it like adjusting a camera. If the camera is pointed in the wrong direction, you see nothing. Here is what each setting means:
| Setting | What It Means | Default Value |
|---|---|---|
| Xmin | Leftmost X value shown on screen | -10 |
| Xmax | Rightmost X value shown on screen | 10 |
| Xscl | How far apart the X-axis tick marks are | 1 |
| Ymin | Lowest Y value shown on screen | -10 |
| Ymax | Highest Y value shown on screen | 10 |
| Yscl | How far apart the Y-axis tick marks are | 1 |
You only need to change the window when your graph is outside the default -10 to 10 range. For example, if you graph y = 100x, the y values get very large very fast. You would need to set Ymax to something like 1000 to see the full line.
Pro tip: Never change the window manually if you don't have to. Just press ZOOM → 0 (ZoomFit) and the calculator automatically adjusts the window to fit your graph perfectly.
The ZOOM Menu — Your Best Friend
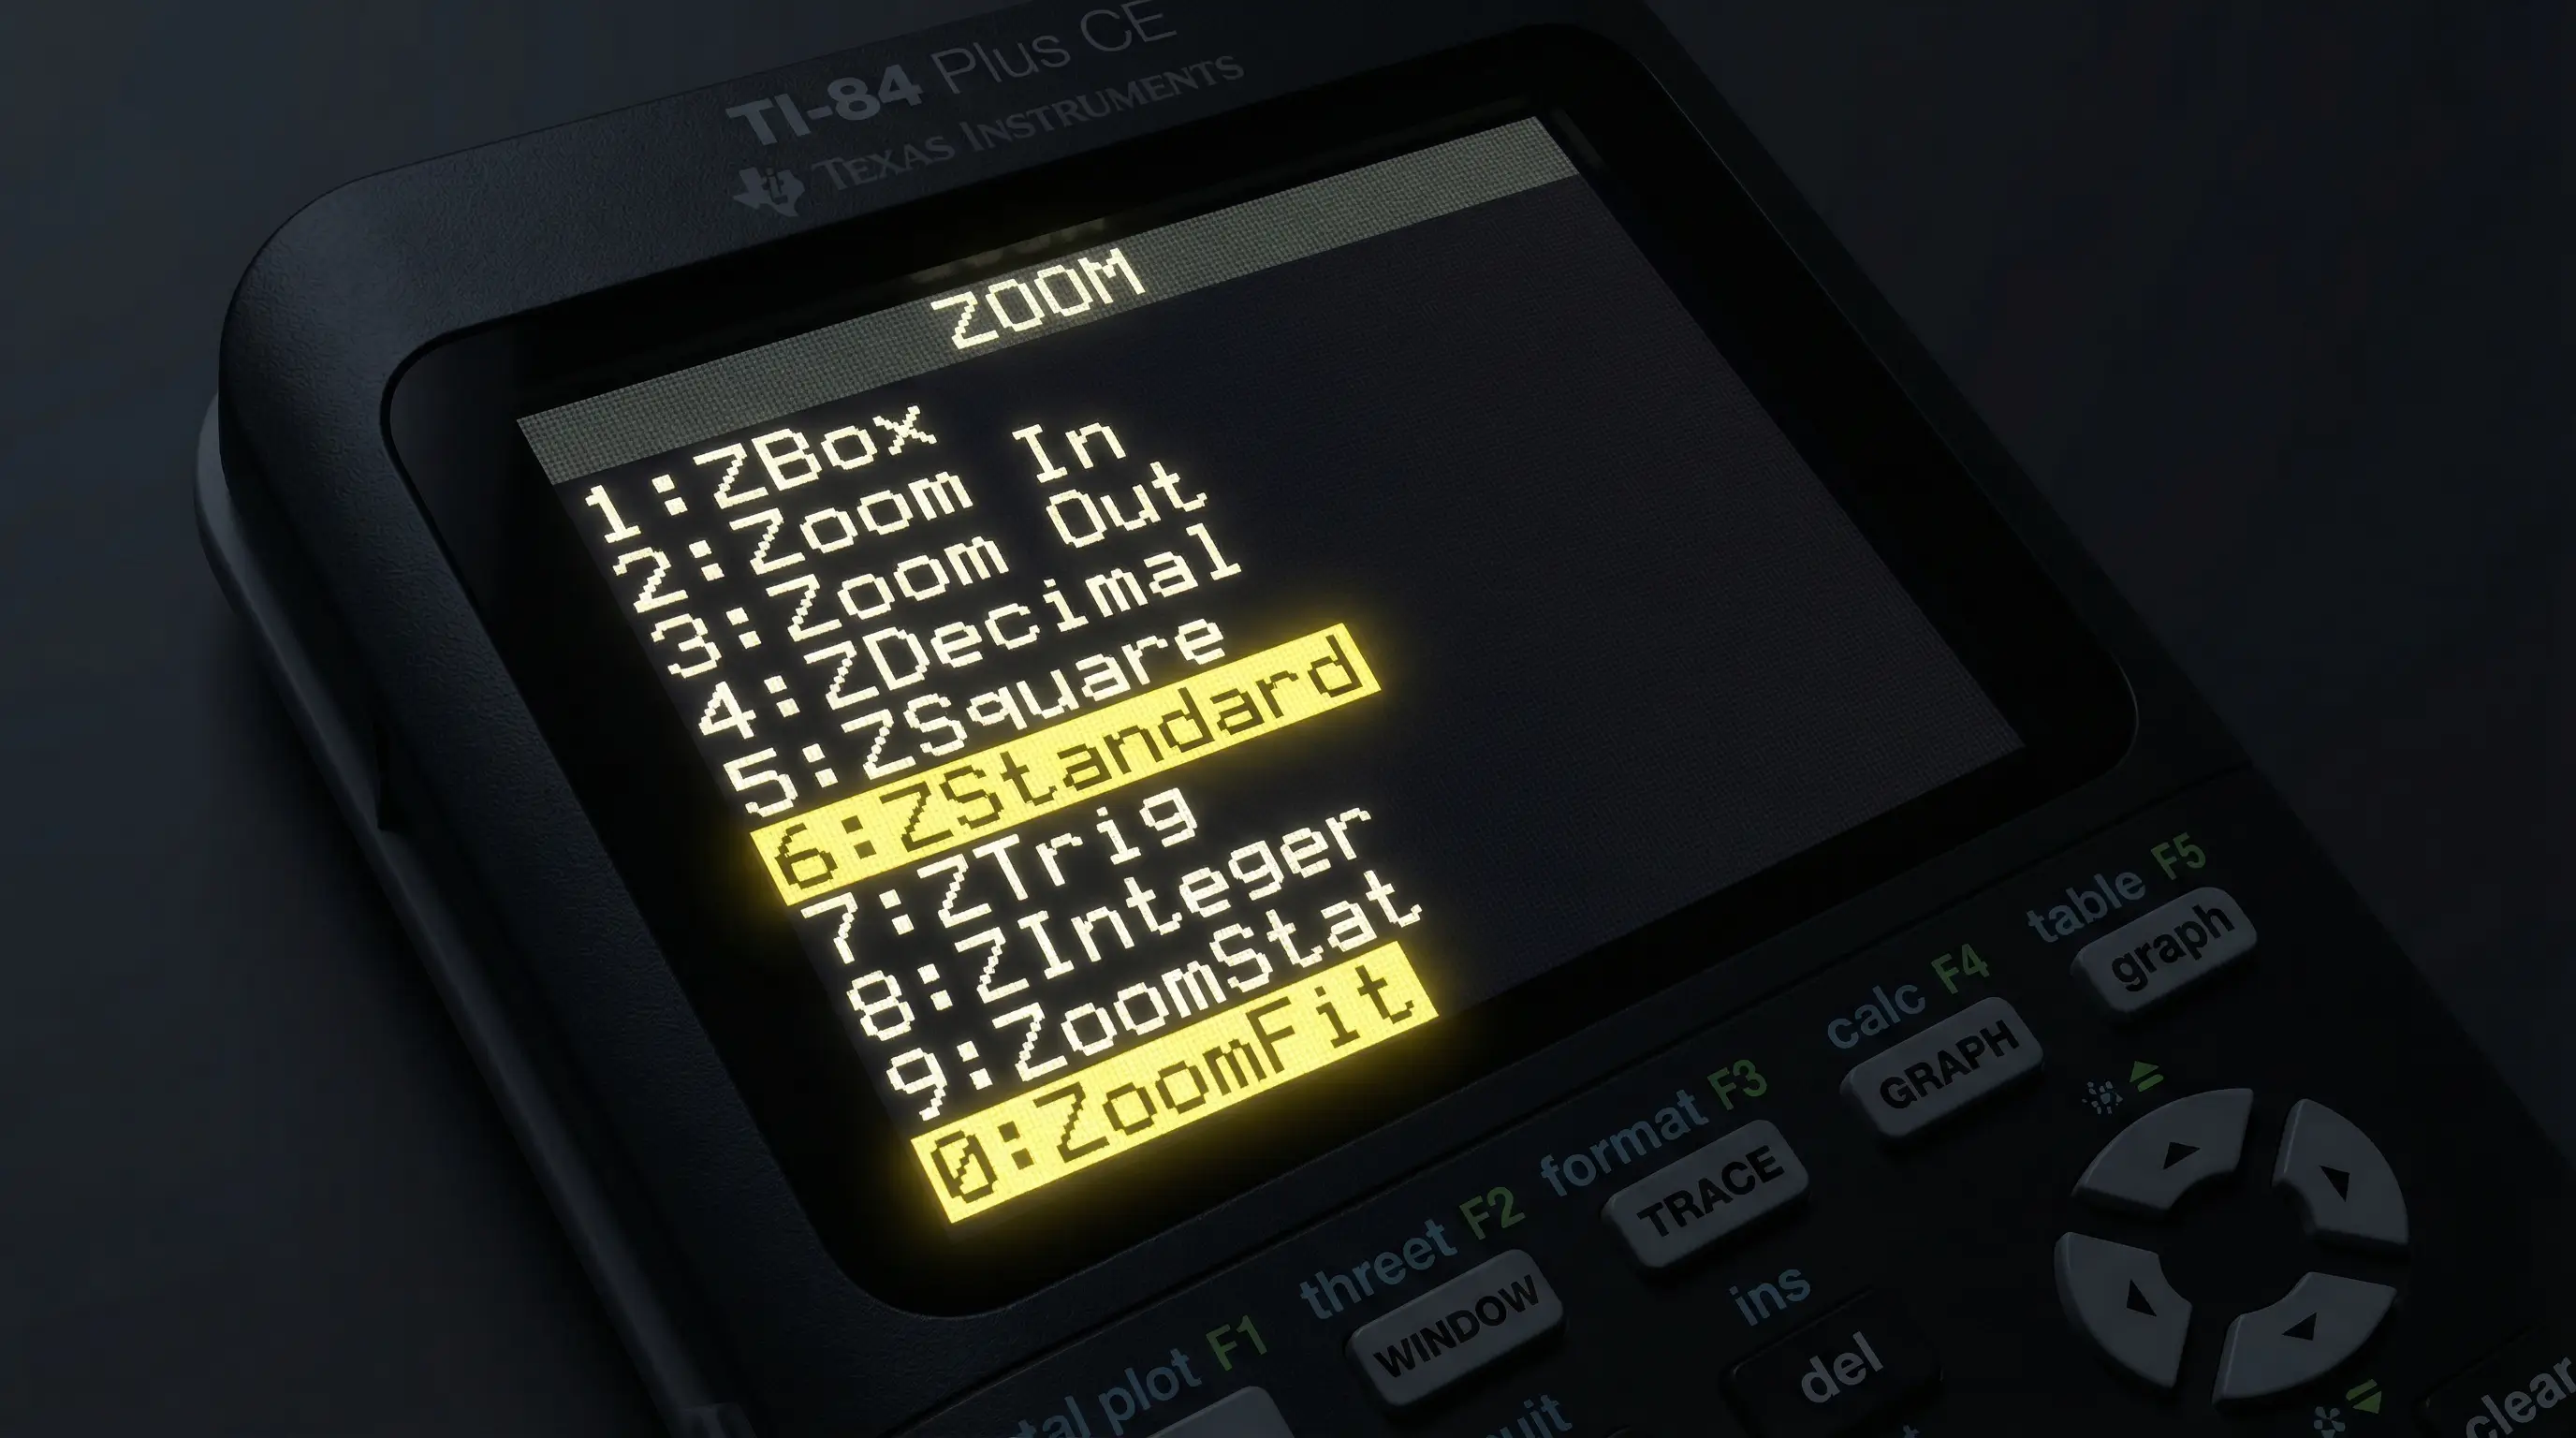
The ZOOM button opens a menu with many options. You do not need to memorize all of them. These three are the most useful for students:
| Button | What It Does | When to Use It |
|---|---|---|
| ZOOM → 6 (ZStandard) | Resets window to -10 to 10 on both axes | When the window looks wrong or messy |
| ZOOM → 0 (ZoomFit) | Auto-adjusts Y range to show your graph | When the screen is blank after pressing GRAPH |
| ZOOM → 5 (ZSquare) | Makes X and Y scales equal (circles look round) | When graphing circles or shapes that look stretched |
How to Graph Two Equations at the Same Time
This is one of the most powerful things the TI-84 can do. You can graph two lines at once and see exactly where they cross — which is the solution to that system of equations. Here is how:
-
1
Enter the first equation in Y1=
Press Y= and type your first equation next to Y1=. Example: 2X + 1
-
2
Move down to Y2= and enter the second equation
Press the ▼ down arrow key to move to Y2=. Type your second equation. Example: -X + 4
-
3
Press [GRAPH]
Both lines appear automatically in different colors. You can see visually where they intersect.
-
4
Find the exact intersection point
Press 2nd + CALC to open the Calculate menu. Select option 5 (intersect). The calculator asks you to confirm each curve and guess near the intersection. Press ENTER three times and it gives you the exact (x, y) coordinates.
For our example (y = 2x + 1 and y = -x + 4), the intersection is at exactly x = 1, y = 3. That means x = 1 is the solution. The calculator confirmed it in about 10 seconds instead of solving two equations by hand.
Common Graphing Mistakes (and How to Fix Them)
These are the mistakes I see students make all the time when they first start graphing on the TI-84. Do not worry — every single one has an easy fix:
-
Graph screen is completely blank.
Fix: Press ZOOM → 6 to reset the window. If it is still blank, press ZOOM → 0 to auto-fit. -
I see a graph but it looks like just a dot or very small.
Fix: Your graph is visible but tiny in the current window. Press ZOOM → 0 (ZoomFit) to zoom in on it automatically. -
I typed the equation but the Y= screen shows an error.
Fix: Make sure you are using the X,T,θ,n key for X — not the alphabet X. Also check for missing multiplication signs. The TI-84 does not understand "2X" — you must type 2 × X (or 2 directly followed by X using the X key, which the TI-84 understands as 2 times X). -
My vertical line graphs as a horizontal line.
Fix: Vertical lines like x = 3 cannot be entered in the Y= menu directly. You need to use DRAW menu for vertical lines. -
The graph flickers or looks broken.
Fix: Change Xres in the WINDOW settings to 1 (the lowest value). Higher Xres values skip pixels and make the graph look dotted. -
My circle looks like an oval.
Fix: Press ZOOM → 5 (ZSquare). This makes X and Y pixel scales equal so circles look round.
What Can You Graph on a TI-84?
The TI-84 can handle almost any equation you will ever see in a high school or college math class. Here is a quick reference:
| Equation Type | Example | Type in Y= as |
|---|---|---|
| Linear (straight line) | y = 3x − 2 | 3X-2 |
| Quadratic (parabola) | y = x² | X^2 |
| Cubic | y = x³ − 3x | X^3-3X |
| Square root | y = √x | √(X) (press 2nd + X²) |
| Absolute value | y = |x| | abs(X) (MATH → NUM → abs) |
| Sine wave | y = sin(x) | sin(X) (press SIN key) |
| Exponential | y = 2^x | 2^X |
Want to explore advanced graphing with sliders, inequalities, and more? Try our free Graphing Calculator — it lets you graph anything online with a full interactive workspace.
🖩 Practice Graphing Right Now — For Free
You don't need to own a physical TI-84 to practice. Our free browser-based TI-84 Plus CE emulator works exactly the same way. No downloads, no sign-ups. Try the steps above right now.
Launch Free TI-84 Calculator →Graphing on the TI-84 for SAT and AP Exams
One of the best things about knowing how to graph on the TI-84 is that this skill saves you serious time on standardized tests. The TI-84 is approved for the SAT, ACT, and AP exams. When you encounter an algebra question that asks for the solution to a system of equations, you can graph both lines in under 30 seconds and read the intersection point instead of solving by hand.
This technique alone can save you 2–3 minutes per test — which is huge when every second counts. If you want to know more about calculator rules on the SAT, read our full guide: Can I Use the TI-84 on the SAT?
Frequently Asked Questions
Press [Y=] at the top-left of the calculator. Type your equation next to Y1= (use the [X,T,θ,n] key for X). Press [GRAPH] to see the graph. If the screen is blank, press [ZOOM] → 6 to reset the view.
The most common reason is a wrong window setting — the graph exists but you are looking in the wrong part of the coordinate plane. Press [ZOOM] → 6 (ZStandard) to reset. If it is still blank, press [ZOOM] → 0 (ZoomFit) to auto-fit. Also check that you entered the equation correctly and used the [X,T,θ,n] key for X.
Press [Y=]. Enter the first equation in Y1=. Press the down arrow to go to Y2= and enter the second equation. Press [GRAPH] and both lines appear in different colors. To find their intersection, press [2nd] + [CALC] → option 5 (intersect).
After pressing [GRAPH], hit [TRACE]. A blinking cursor appears on the line. Use the left and right arrow keys to move the cursor along the graph. The X and Y coordinates for each point show at the bottom of the screen in real time. To jump to a specific X value, type the number while in TRACE mode and press Enter.
Graph both equations first (Y1 and Y2). Then press [2nd] + [CALC] to open the Calculate menu. Select option 5 (intersect). Press Enter to confirm the first curve, Enter again to confirm the second curve, then move the cursor near the intersection and press Enter one more time. The calculator shows the exact X and Y values of the intersection.
Press [Y=]. Type sin( by pressing the [SIN] key. Then press [X,T,θ,n] for X, then [)] to close. Press [GRAPH]. If the graph looks flat, make sure your calculator is in Radian mode (press [MODE] and select Radian). For a full wave, set Xmin = 0 and Xmax = 6.28 (which is 2π).